Tuesday, December 1, 2015

Display Board Help

Here are some helpful hints about how to put together a science fair display board.

Several of these hints and tips come from this PowerPoint: Display Board Help Just click on the link and it should direct you to a helpful PowerPoint.

  • The display board should be read like a newspaper from top to bottom and left to right.
  • Include all the necessary parts for the science fair project including, title, abstract, purpose, hypothesis, variables, research paper (may also go on the table in front of the board), materials, procedures, data tables, graphs, results, conclusion, and possibly acknowledgements.  The different parts are generally put in the order of the project from start to finish. The abstract may go in the beginning or the end. Everything should be typed.
  • Use only a few main colors that compliment each other and are easy to read and stand out. If it doesn't read well on the computer, it won't read well on the board. A few accent colors can also be added, but sometimes simple looks best.
  • Include pictures of your experiment. The saying, "a picture is worth a thousand words," holds very true for the display board. 
  • Create everything for the display board, lay it all out on the board and make sure it is how you want it, and then glue everything down.

Here is an animated guide to the display board with a link to some great do's and dont's.
Science Fair Central

Examples:
Great color scheme! Even the graphs use the same three colors.

Another nice board with easy to read sections and great pictures.

Writing an Abstract

An abstract is a summary of the whole science fair project and should be written towards the end. The abstract should include a sentence or two from each phase of the project. The abstract does not need to be very long, maybe a half a page to three quarters of a page of a decent sized font.

Pretend someone asked a student, "What was your science fair project about?" The student will probably include some words on their purpose or question, a few words on their background information, a few words on their hypothesis and variables, some words on how they did their experiment, some words on their results, and a few words about their conclusion.  These are all the parts in the correct order of an abstract. One helpful hint if a student is having trouble writing an abstract is to ask them this very question and encourage them to verbalize their answer before writing it.

Here is an abstract question stem from Williamsclass.com Science Fair Guide: "Writing the Abstract"


Fill in the following lines to create a successful Abstract:


The purpose of my science fair project was ________________________

________________________________________________________

An interesting piece of background knowledge is ___________________
___________________________________________________________

My hypothesis for this project was______________________________

__________________________________________________________

The constants and control in my experiment were____________________

___________________________________________________________


 The variables in my experiment was _____________________________

___________________________________________________________

The conducted my experiment by ________________________________

____________________________________________________________

The results of this experiment were (just the most important) ___________

____________________________________________________________


The results show that my hypothesis was wrong or right because 
____________________________________________________________

____________________________________________________________

If I were going to do this experiment again in the future or expand on this experiment I would
____________________________________________________________
____________________________________________________________
Sample Abstract:


Abstract

Rocketry has been around for a long time. Scientists, people who build model rockets and the military all use different kinds of rockets. Studying rockets is important because it helps us to learn about outer space. This project is using different amounts of water and air to make rockets fly. My hypothesis was that more water will make the rocket fly the longest. The independent variable was the different amounts of water and the dependent was the time in seconds that the rocket flew. I used a two liter bottle and a bottle launcher. I launched the bottle filled 1/3, 1/2, 2/3, 3/4, and the whole two liter bottle with water. The longest flight was the 1/3 filled bottle. It went 10.5 seconds. The whole bottle went 1.5 seconds and this was the shortest flight. The rocket barely got off the launcher. My hypothesis was incorrect. The least amount of water flew the longest. This happened because there was more air and less mass to get off the ground. The most amount of water had too much mass and too little air to fly.

Writing a Conclusion

The conclusion is a very important part of the science fair project. The conclusion wraps up the whole project by revisiting the hypothesis, explaining the results and most importantly shows the student's thinking.

Here are some steps or important parts to consider when writing the conclusion:

  • Explain if the hypothesis was right or wrong and most importantly why. I always tell students that there should be a "because" in their conclusion.
    • My hypothesis was that the organic fertilizer would cause the tallest growth in sunflower plants. My hypothesis was wrong because the Grow Fast fertilizer actually caused the plant to grow the tallest.

  • Include results that support your conclusion.
    • My hypothesis was that the organic fertilizer would cause the tallest growth. My hypothesis was wrong because the Grow Fast fertilizer actually caused the plant to grow the tallest. The Fast Grow fast plant grew 25 inches and the organic plant only grew 15 inches.

  • Include reasons why the experiment turned out the way that it did. These reasons show a student's level of understanding about the project. These can also be educated guesses as to what happened based on what the student has learned throughout the project.
    • My hypothesis was that the organic fertilizer would cause the tallest growth. My hypothesis was wrong because the Grow Fast fertilizer actually caused the plant to grow the tallest. The Fast Grow plant grew 25 inches and the organic plant only grew 15 inches. This may have happened because the Grow Fast fertilizer had more nitrogen in it. Nitrogen is very important in helping plants grow
    • (May or may not be right, but shows the student is trying to make sense of their results by applying what they learned, especially during the research phase. When students think critically about their results, it can lead to some great "aha" moments.)

  • The conclusion may include more questions that the students may have thought as they conducted the experiment and should include anything that they might have done differently. Again more examples of critical thinking.
    • My hypothesis was that the organic fertilizer would cause the tallest growth. My hypothesis was wrong because the Grow Fast fertilizer actually caused the plant to grow the tallest. The Fast Grow plant grew 25 inches and the organic plant only grew 15 inches.This may have happened because the Grow Fast fertilizer had more nitrogen in it. Nitrogen is very important in helping plants grow Sunflower plants grow pretty quickly. I  wonder if the different fertilizers would have the same effect on slower growing plants. I also wonder about the effects of the fertilizers on the quality of the plants over a long period of time. if I were to complete this experiment again I would experiment over a longer period of time and not only focus on growth, but also quality. I would also experiment with s type of flower and a type of fern.


  • In the conclusion, students can also connect to the real world and discuss why the experiment is important for others. The students can also discuss the impact that their conclusion can have on science, people and the real world. This is often referred to as real world implications. 
    • My hypothesis was that the organic fertilizer would cause the tallest growth. My hypothesis was wrong because the Grow Fast fertilizer actually caused the plant to grow the tallest. The Fast Grow plant grew 25 inches and the organic plant only grew 15 inches.This may have happened because the Grow Fast fertilizer had more nitrogen in it. Nitrogen is very important in helping plants grow. Sunflower plants grow pretty quickly. I  wonder if the different fertilizers would have the same effect on slower growing plants. I also wonder about the effects of the fertilizers on the quality of the plants over a long period of time. if I were to complete this experiment again I would experiment over a longer period of time and not only focus on growth, but also quality. I would also experiment with s type of flower and a type of fern. My experiment shows that the organic fertilizer did not work as well. Anything organic has become popular in recent years. Organic items will not be as popular if they do not work as well. If organic products are going to be the wave of the future, then these types of products need to work as well a what is already available. 


Writing a Summary of Results

A summary of results is just like it sounds. It is a summary or review of the data or results in the experiment. The summary does not necessarily have to include every single piece of data, especially if there are many data entries, but should include the most important or relevant to the experiment. The high and low, the average, and the most consistent results are some examples of results that could be included in the summary of results paragraph. It is important to note that there is no explanation in the summary as that is saved for the conclusion.

Here is one example:

Results

The bottle filled one-third amount of water had 90 pumps of air. The bottle flew for 10.5 seconds. It went the highest and the longest. The bottle filled with one-half amount of water had 80 pumps of air and it flew for 5.4 seconds. This bottle went straight up and did two flips. The bottle filled with two-thirds amount of water had 72 pumps of air and flew for 4.3 seconds.  This bottle flew to the left. The bottle filled with three-fourths amount of water had 50 pumps of air and flew for 3.5 seconds. The bottle that was full of water had 18 pumps of air and flew for 1.5 seconds. It barely got off the ground.


Here is another explanation from Williamsclass.com Science Fair Guide http://www.williamsclass.com/ScienceFair/ScienceFairResults.htm


Your results should follow these guidelines:
  1. Include what you wanted to accomplish and prove during your experiment.
  2. Describe and report what you discovered. Be sure to include any data that might have been collected. It is important to show this data even if it did not support your hypothesis. The process of completing the experiment with true data is what is important.
  3. The function of the Results section is to objectively present your key results, without interpretation.

Fill in the blanks below to create a quality Results page.

The original purpose of this experiment was to _____________________

The results of the experiment were ____________________________


The balloons with one-candle power had flight times of 14.2 seconds, 15.1 seconds, 14.8 seconds, and 15.1 seconds for an average of 14.8 seconds. The balloons with two-candle power had flight times of 12.6, 13.2, 13.0, and 13.2 seconds, for an average of 13.0 seconds. The three-candled balloons had times of 11.2, 10.4, 10.2, and 9. 8 seconds for an average time of 10.4 seconds. Therefore the number of candles determined the speed at which the balloon rose: three candles were quickest, two candles second, and the single candle balloon the slowest.

Creating Data Tables on the Computer

There are several different ways to create data tables in a word program like Microsoft Word and in a spreadsheet program like Microsoft Excel.

Here is a tutorial for inserting a table into Microsoft Word 2010.


Here is part two which provide even more helpful hints. These may not just help with the science fair, but also with navigating through Microsoft Word in general.


Another way to create a data table is to use a spreadsheet program like Microsoft Excel. Excel may seem a bit more challenging at first, but offers a wider variety of tools to use. It is also much easier  to create graphs out of Excel. My recommendation is to use Excel to create data tables. Here is a link to an Excel tutorial that provides some basic descriptions for Excel.

Here is a quick tutorial on some of the functions and commands of Excel.


That video comes from this website which has many lessons on Excel and every lesson includes a video. To find the other lessons, just click on the lessons button and scroll to a lesson that you would like to view.

These are all helpful and there are many more tutorials, lessons, and videos on the Internet that can help students and parents learn to use these programs, but one of the best teachers is practice and experience. One of the best ways to learn is to experiment  with the program and try different things, you'll be amazed at what you learn!

Working with Data

Here is a quick how to on working with data for a science fair experiment or any project or experiment that involves gathering a lot of data.

The benefits on working with data is that it helps to provide a better picture of what happened during the experiment. Another benefit is that it can make creating data tables and graphs easier.

There are many ways to work with data, but here are the four most common and their definitions. Remember, putting the numbers in order from least to greatest is important to do before working with the data.

 
Mode – The number that appears the most


Range – The difference between the largest number and the smallest number.


Median – The number in the middle of the data set. Remember you need to have an equal amount on each side of the median.


Mean – The average, add up all the numbers and divide by the total number of items. This is probably the most frequently used in working with data.
Here is an interactive that is helpful in reviewing these concepts.

Creating Graphs and Charts

There are several different ways to create computer generated graphs and charts. One way is to use Excel especially if a data table has already been created. This way will be explained in greater detail later on in the post. Another way, especially if the data table was created in Word, is to use a graphing program on the Internet. One of those programs is called Create a Graph. This website allows students to input data into a set format and will create a graph based on the data. There is also a very helpful Create a Graph tutorial that explains all the features of graphing.

Here is a graph that was completed in just a few minutes on Create a Graph.


The other way, as previously mentioned, is to graph using Excel. Here is one video on the basics of creating a bar graph in Excel.


Here is another video on Excel that takes a slightly different approach.


There are also many tutorials online on how to create graphs or charts in Excel. Here are two different examples:

Click here or click here

Remember one of the best ways to learn a software program is to practice and experiment with it.

Friday, November 13, 2015

Farming in Mesopotamia Homework

Here is a great site for learning how civilizations farmed in Mesopotamia. It is also the website students will need to complete their homework.

Mesopotamia Farming Challenge

Friday, November 6, 2015

Gestures for Sound Waves

Check out this video to help you study for our sound waves test!


Sound Waves

This week we have been learning a lot about sound waves and their properties. There are many resources on the Internet about sound waves including simulations and tutorials, games, websites, and videos. Here are a few:

This an interactive where students can hear the change in pitch and volume as they adjust the frequency and amplitude. Also includes some other concepts that we didn't study in class that the students may find interesting.

Sound


Click to Run


This is another interactive that students may enjoy.


A great website with lots of links to many activities can be found here. One of links is to a website with the definitions of parts of a wave. Students can make adjustments on the actual wave. Check it out by clicking here.


Here are two short videos on what a longitudinal wave looks like and what a transverse wave looks like.


Here is a video on the difference between longitudinal waves and transverse waves. The video contains more of the higher level math and formulas related to waves, but the beginning does a nice job of showing the difference between the two types of waves.

Sunday, October 11, 2015

Writing a Science Fair Project Research Paper

The research paper, a favorite among students and parents or a struggle that can take a lot of time to research and write? It is often a struggle, but many students have said this is where they learned the most during their time with the project. They learn about all different types of science topics and how to research, write note cards and outlines, and how to cite information, something that will be useful for the rest of their education. Here are some steps on how to write the actual paper and how to cite sources in text.

Before we begin, it may be useful to review what a background research paper is and is not. This post offers an explanation on just that. That post also explains how outlines can be helpful as well.

Once students have completed an outline, then have students write a paragraph or more on each section of the outline. If the student has struggled to create an outline ask questions and encourage research to find more to put on the outline. Sometimes it is helpful to start writing as the student may discover more concepts to write about as they move forward. Here is a sample outline with a sample paragraph. This piece of the outline and paragraph would be an example of one of the paragraphs in the body of the paper.

Quick background note: This project is on the effect of motor oil on plants. This is an excerpt of an outline.

     III. What is motor oil? (Strong topic idea, may be in statement or question form)
   
           A. Definition

           B. What is made of?

           C. Different types
    

Now using research that the students have found, begin writing a paragraph expanding on the topics in the outline. Sometimes students may have to complete more research as they write if they find out they do not have information on topics included in the outline. For example, I may have research on the definition and different types of oil, but not on what it is made of. Now the student, instead of struggling with what to search can be specific and search, "what is oil made of?". Please refer to this post on how to do an advanced search in Google.

Paragraph example:

     Motor oil is used in many different vehicles like cars and buses that have engines. The oil prevents the pistons from hitting or rubbing up against the engine (Learn About Chemicals Around Your Home). Motor oil comes mostly from something called crude oil. Used motor oil can also have chemicals in it from moving through the engine like magnesium, copper, and zinc (Learn About Chemicals Around Your Home). There are different types of engine oil and they are mostly based on weight, body, and viscosity. Some examples are "5W, 10, 10W, 20, and 20W" (Oil Consideration to Lengthen Engine Life).

The parenthesis show that the sentence or sentences are information that I paraphrased or directly quoted (the one with the quotation marks) from a source, in this case two websites. This would be just one paragraph of a six or more paragraph paper. A paper on this topic might include information on motor oil, the type of plants that would be used in the experiment, and oil pollution.

Tuesday, October 6, 2015

Science Fair Research Paper Planning: The use of Outlines

What is the science fair research paper? What is it not?

What it is: a paper written about the important concepts related to the particular science fair idea. It is a third person (no I, me, or we) formal writing that is written using research from resources like books and websites. The paper helps the student learn all the background information about their project so that he/she can write an informed or educated hypothesis and to help the student better understand what happens during the experimental phase of their project. Students will have to cite their research (write where they found their information) within the writing. Students will use parenthetical citation (a fancy way of saying parenthesis) in their paper to cite their sources. More information will be provided to help students do this, but in looking at the example provided in this post you can see the parenthesis.

What it is not: a paper specifically about the person's experiment, including what they are doing, their results and any conclusions.

Here is a sample of a research paper. This does not include a cover page, but will give a good idea of what a research paper may look like.

The question for many is, how do we get from resources like websites, encyclopedias, and books to a 1 1/2 to 2 page research paper. The answer is organized research. Organizing the research into manageable pieces can be very helpful. How is that done?

Several different ways. One way is to use note cards and literally group the note cards with similar information into piles. This is a great visual way to help students "see" their different paragraphs.

One important piece of information to keep in mind is when ever a student finds a piece of information from a resource, the student needs to write down where that information came from. Even if the student changed the words around, that information still needs to be referenced or cited in the paper.


Another helpful way that can be used separately or even better with note cards is an outline. An outline helps the student break their paper down into smaller pieces. A well written outline makes the paper much easier to write. Also when writing the student can use the outline to write one paragraph at a time, making it easier to work on the paper over several days, which helps the paper seem not as intimidating.

Here are two examples of outlines done this year.


Thursday, October 1, 2015

How to Use Advanced Search in Google

Sometimes students have a hard time sorting through the millions of different websites that are out there on the world wide web. One way to help this is by using the advanced search on Google.

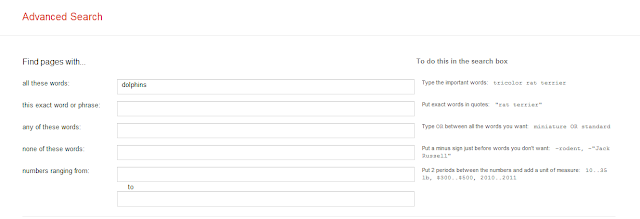
First, open Google. Then click on the settings button pictured here. Then click on advanced search.

There are several different options  once you have opened the advanced search. Here are a few:

Use the first section to be more specific on the words that you want used or not used in the search:


Another option that is very helpful is the site or domain box pictured here:

 Fill this box in with the type of URL ending that you are looking for. Information on .edu or .gov websites tends to be more reliable than on .com or .org websites. I have had more success using one ending at a time.


Another option is reading level. There are three levels that you can sort your searches by: basic, intermediate, and advanced.


Ever tried to find a power point online? File type is another option. This can limit your search to pdf files, word doc files, power point files, and others including swf or flash files used in multimedia.


The last item on advanced search is related to usage rights. These help you find images and websites that allow you to use them in presentations of your own.


Once you have completed it, just click on the advanced search button

Tuesday, September 22, 2015

More Variable Practice

Here are several online quizzes and practice problems to help practice identifying scientific variables in experiments.

Identifying Independent and Dependent Variables

IXL Identifying Variables

Variables Quiz

Identifying Variables in a Science Experiment

Typically in a unit on the scientific method, the biggest hurdle for students is understanding and identifying the different types of variables in a science investigation or experiment.

A variable is anything that could change during an experiment. This post will walk through the different variables. Also be sure to check out a a future post on writing and understanding a hypothesis as that will also help gain a deeper understanding of this concept.

Independent Variable - Also called the manipulated variable. This is what the person doing the experiment changes or what is being tested or the attempted solution to a problem.

Ex. 1 - A person is experimenting with how fast sugar dissolves in different temperatures of water. The person has three cups of water at three different temperatures. The independent variable is the different temperatures of water.

Ex. 2 - A person is testing different stain removers on grass stains. The different stain removers would be the independent variable.

Ex. 3 - You are having trouble waking up in the morning (major problem) so you decide to find a solution. You try different types of music as your wake up song in the morning. The independent variable would be the different types of music.

What do you think? Make sense? Let's move to dependent variable.

Dependent Variable - Also called the responding variable because it responds or depends on the independent variable (rock and roll song with a major drum solo, you wake up and get to school on time, light classical music, sleep till noon.) One of the best ways to identify the dependent variable is to find what is being measured or observed. In other words, you are looking for the results.

Ex. 1 - In example one, a person is experimenting with how fast sugar dissolves in different temperatures of water. The time that sugar dissolves depends on the temperature of the water. The time that the sugar dissolves is also what is being measured. This means that the dependent variable  is the time the sugar dissolves.

Ex. 2 - In example two, a person is testing different stain removers on grass stains. How clean the stain is or in other words how much of the grass stain is gone is the dependent variable.

Ex. 3 - In example three, the dependent variable would be the time it takes you to wake up in response to the type of music being played on your alarm clock.

Good review so far? One more variable to go.

Control / Constant  / Standardized Variables - Variables that should stay the same in order to have a "fair" experiment.

Ex. 1 - Sugar / water experiment. Control variables would include the type of sugar, the amount of water, the cup used. These are all variables that should be the same in every trial.

Ex. 2 - Stain removers. Control variables would include the type and size of the stain, how long the stain remover sits, and what the stain is put on (like a t-shirt).

Ex. 3 - Alarm Clock. Control variables would include the loudness of the alarm, how long the snooze button is set for, and the time the alarm is set for.

Here is a link to an online quiz on variables. Give it a shot, one of the best ways to learn this is by lots of practice.

Introduction to Scientific Variables

This is a fun, descriptive video on scientific variables.


Wednesday, September 16, 2015

Scientific Method: Boat Day Part 1

Here is a video related to our activity in class. Come to class ready to change or modify your design from today. We will see who's design can hold the most washers without tipping or sinking. Remember the scientific method is all about problem solving and critical thinking.


Saturday, August 15, 2015

Science over the Summer

Science in the summer? For many students science does not end in June, but continues throughout the summer. Whether it is investigating shells on the beach, conducting experiments at home, or engaging in a science camp, many kids continue to learn about the world around us even when not in school. Here are a couple of examples from our very own school. 

One of our former students, Samantha K. participated in Summer Ventures at ECU. Summer Ventures is a program that encourages learning and investigating science at a high level for juniors and seniors in high school. Samantha studied archaeology and neuroscience and even investigated Alzheimer's disease. 

One of our current students. Ruth H. also attended a science camp this summer. She went to a STEM camp which focuses on science, math, and technology. 

We also had many students complete at home experiments and projects. Here is a picture from Greyson T. Nothing like creating a homemade volcano with a rising pyroclastic flow. 


Post a comment about what you did this summer related to science. It could be anything from digging in the dirt to seeing how fast you could get your bike to go, to hanging out at Discovery Place. 

Friday, January 23, 2015

Science Interactives

There are many science interactives on the Internet. Try different ones and post a comment about it. Describe the simulation, write about what you learned, or what you liked about the simulation.

PHET Colorado

Weebly Science Interactives


Wednesday, January 14, 2015

Human Eye and Vision Problems

Here are several interactives that help with parts of the eye and correcting nearsightedness and farsightedness:

Parts of the Human Eye

Fixing Vision Problems

Here is a video that does a nice job describing vision problems.


Friday, January 9, 2015

Colored Filters and Objects

Here is the website we used in class to learn about how objects appear as the color that is being reflected.

Colored Filters

Thursday, January 8, 2015

Refraction

Why does that diamond ring sparkle so much? Why does that fish in the pond not exactly appear where you thought it was? Why, refraction of course. Here are several websites and demonstrations that help with the concept of refraction.

Refraction

Refraction through a glass block

Bending Light

Sunday, January 4, 2015

Winter Break

I hope everyone had a great winter break. What did everyone do? Send some pictures to me and I will post some pictures of what students did over break. Here are some of my pictures from a trip to Indianapolis last week. 
Indiana University football stadium
Downtown Indianapolis
More downtown Indianapolis
Downtown canal
 NCAA Hall of Champions Museum
Inside the NCAA Hall of Fame 

The Electromagnetic Spectrum

There are several websites that are helpful in describing the electromagnetic spectrum. Here are two of them.

http://www.darvill.clara.net/emag/

http://missionscience.nasa.gov/ems/index.html

In the above website there is also a video series that reviews each part of the electromagnetic spectrum. This video series can be found here: http://missionscience.nasa.gov/ems/emsVideo_01intro.html